The Margin Gap · Budget Decisions
Marketing Budget Allocation: How to Decide Which Campaigns to Scale, Hold, Cut, or Pause
Marketing budget allocation is how you decide where every marketing dollar goes. Most advice stops at splitting money between channels. But profit is won or lost one campaign at a time, and the campaign with the best-looking dashboard is often not the one making you the most money. This guide shows you how to allocate your budget by real profit, and when each campaign should be scaled, held, cut, or paused.
Key takeaways
- Marketing budget allocation happens at two levels: how much you spend in total, and which campaigns get it.
- Channel rules like 70/20/10 set the big buckets, but they can’t tell you which campaigns inside a channel are losing money.
- Allocate by each campaign’s contribution margin (profit after every variable cost), not by ROAS.
- Every campaign needs one clear call: scale, hold, cut, or pause. Four more calls (flag, investigate, renegotiate, quarantine) catch problems most owners miss.
- In our example, the campaign with the best ROAS ranks second on profit, and one campaign is losing money despite a 3.0 ROAS.
What Is Marketing Budget Allocation?
Marketing budget allocation is the process of deciding how much to spend on marketing and where that money goes. It happens at two levels:
- The total budget. How much of your revenue goes to marketing at all.
- The split. How that budget is divided between channels (search, social, bought leads, display) and, inside each channel, between individual campaigns.
Most guides spend their time on the first level and the channel split. That’s useful for planning. But the decisions that actually change your profit happen at the campaign level, because that is where money is added, reduced, or switched off every week.
Good marketing budget allocation answers one question for every campaign you run: should the next dollar go here, or somewhere else? Answering it well takes the right number, and ROAS is usually the wrong one.
How Much Should You Spend on Marketing?
There is no universal percentage, but benchmarks help. Gartner’s 2026 CMO Spend Survey puts the average marketing budget at 7.8% of company revenue. That survey asks CMOs, so it skews toward larger companies with dedicated marketing departments.
For a small or mid-sized business, the better test is simpler: spend more wherever an extra dollar of marketing returns more than a dollar of profit, and less wherever it doesn’t. A benchmark tells you what others spend. Your own campaign profit tells you what you should spend.
That is why the two levels of marketing budget allocation, the total and the split, can’t really be separated. If you know which campaigns are profitable and which are not, the right total budget becomes much easier to see.
Why the 70/20/10 Rule Isn’t Enough for Marketing Budget Allocation
The most common marketing budget allocation rule is 70/20/10: about 70% to proven channels, 20% to growing ones, and 10% to experiments. Smart Insights explains the model as a way to split spending into three differently sized areas so priorities are clear.
It’s a reasonable way to balance safe bets against new ones. The problem is what it can’t see. A rule like 70/20/10 works at the channel level, and channels are averages.
“Paid search is working” can hide one campaign earning 33 cents on every dollar and another losing money. If you allocate by channel, the losing campaign keeps its budget because its neighbors are carrying it. Budget moves campaign by campaign, so that is the level your marketing budget allocation has to reach.
A good template also can’t account for your costs. Two businesses with the same 70/20/10 split can have completely different results once refunds, partner payouts, and the cost to deliver the work are counted.
Allocate by Profit per Campaign, Not by ROAS
Most ad dashboards rank campaigns by ROAS. HubSpot defines ROAS as the revenue earned for every dollar spent on advertising. It’s a fast efficiency check, but it’s not profit. It leaves out:
- refunds, cancellations, and chargebacks that arrive after the sale
- the cost to deliver the work the campaign won
- lead vendor and partner payouts
- payment and financing fees
- commissions and compliance costs
The number that includes all of that is contribution margin: revenue you actually kept, minus every variable cost of winning it. The Corporate Finance Institute calls the marketing version contribution margin after marketing, and MarTech argues that marketing should be judged on it rather than on revenue.
When you base marketing budget allocation on contribution margin, the ranking of your campaigns often changes completely. Our guides on how to calculate contribution margin and net marketing contribution walk through the math step by step. The short version: allocate budget to the campaigns that keep the most profit per dollar, not the ones that report the most revenue.
The Four Core Budget Decisions: Scale, Hold, Cut, Pause
Once you know each campaign’s profit, marketing budget allocation comes down to four decisions. Every campaign should have exactly one of them at any given time.
SCALE Spend more here
The campaign is clearly profitable after every cost, the numbers are steady, and there is enough data to trust them. Scale in steps rather than all at once. Profit per dollar usually changes as spend rises, and big jumps can disrupt the ad platform itself. Meta’s help center notes that pausing an ad set is a “significant edit” and that budget changes can be too, which can send delivery back into its learning phase.
HOLD Keep this steady
The campaign is profitable, but not clearly improving, or the data is still thin. Holding is an active decision: keep the budget where it is and let more results come in before moving money in either direction.
CUT Reduce spend
The campaign is barely earning its keep, or its profit is sliding. Cutting reduces the budget without switching it off, so you stop overspending while you find out whether it can recover.
PAUSE Stop this now
The campaign is losing money after its deals have had time to close, or something is badly wrong, like a surge in fraud or chargebacks. Every extra day of spend makes the loss bigger, so the budget goes to zero until the problem is understood.
The timing rule that matters most: never judge a campaign before its sales could have closed. A campaign with a 60-day sales cycle will look like a loser at day 20. We cover this for law firms in why 30-day CAC dashboards fail on personal injury cases, and the same logic applies to any business where deals take time.
Four More Decisions Most Owners Never Make
Scale, hold, cut, and pause cover the budget itself. But some of the most expensive problems in marketing aren’t budget problems. They are data problems or partner problems, and they need a different kind of decision:
Flag
A person should look at this. The numbers don’t add up, and acting on them automatically could do damage.
Investigate
Something changed and needs a closer look before any money moves.
Renegotiate
A lead partner or vendor is taking too much of the margin. The fix is a conversation, not a budget cut.
Quarantine
The data looks suspicious, so it’s kept out of every decision until it’s cleared.
These matter because, in marketing budget allocation, a wrong budget call made on bad data is worse than no call at all. If you buy leads, the renegotiate decision alone can be worth more than any budget shift. See how chargebacks inflate true marketing cost and how financing fees eat home services margin for two costs that quietly change these calls.
Marketing Budget Allocation Example: Reallocating $60,000 a Month
Here is an illustrative marketing budget allocation example for a home services business spending $60,000 a month across four campaigns. The cost to deliver the work runs 45% of the revenue kept. Watch how the ROAS ranking and the profit ranking disagree.
| Campaign | Ad spend | ROAS | Revenue kept | Contribution margin | Decision |
|---|---|---|---|---|---|
| A. Search: emergency repair | $20,000 | 5.5× | $105,000 | $34,750 (33.1%) | SCALE |
| B. Bought leads: partner network | $15,000 | 6.4× | $75,000 | $11,250 (15.0%) | HOLD |
| C. Display: brand awareness | $10,000 | 2.4× | $22,000 | $1,100 (5.0%) | CUT |
| D. Social: financing promo | $15,000 | 3.0× | $33,000 | −$850 (−2.6%) | PAUSE |
| Total | $60,000 | 4.6× | $235,000 | $46,250 (19.7%) |
How the numbers were built:
- Campaign A reported $110,000 in revenue and lost $5,000 to refunds. After $47,250 to deliver the work, $20,000 in ad spend, and $3,000 in fees, it kept $34,750.
- Campaign B has the best ROAS at 6.4, but $21,000 of its $96,000 came back as refunds and chargebacks. Partner payouts ($9,000) and financing fees ($6,000) take another $15,000. It’s profitable, but at less than half the rate of A.
- Campaign C brings in $24,000, loses $2,000 to refunds, and keeps just $1,100 after costs.
- Campaign D reports $45,000 on $15,000 of spend, a 3.0 ROAS that beats C. But $12,000 in refunds and chargebacks plus $4,000 in fees push it below zero.
A ROAS-based marketing budget allocation would move money toward B, keep D, and cut C first. A profit-based one scales A, holds B (and looks hard at that partner payout), cuts C, and pauses D, assuming its deals have had time to close.
One honest caveat: moving money into Campaign A only helps if A keeps its margin as spend rises. That is why scaling happens in steps and gets rechecked, never in one big jump. These decisions are illustrative. A real decision should also weigh how much data there is, which way the numbers are trending, and the sales cycle.
How Often to Review Your Marketing Budget Allocation
Most businesses review their marketing budget allocation monthly or quarterly, when the books close. By then, a losing campaign has already spent a month or more of budget.
The better rhythm is to watch every campaign continuously, then move money only when the numbers genuinely change. Two rules keep that from turning into constant tinkering:
- Match the window to your sales cycle. Judge each campaign over a rolling window long enough for its deals to close. For many businesses, 30 days is a sensible default. For others, like HVAC in peak season or law firms with long case timelines, it needs to be longer. See why flat HVAC budgets waste money and what the right HVAC channel mix looks like.
- Don’t flip-flop. A decision should change only when the numbers move enough to matter. Scaling on Monday and cutting on Wednesday wastes money and confuses the ad platforms.
Five Marketing Budget Allocation Mistakes to Avoid
1. Allocating by ROAS alone
ROAS ignores every cost after the click. As the example shows, the highest-ROAS campaign can be far from the most profitable. Our breakdown of why ROAS can look good while campaigns lose money goes deeper.
2. Stopping at the channel level
Channel averages hide losing campaigns. Take your marketing budget allocation down to the campaign, because that is where money actually moves.
3. Judging campaigns too early
Cutting a campaign before its deals could close punishes your slowest-converting, often most valuable, customers.
4. Ignoring what happens after the sale
Refunds, chargebacks, and partner payouts arrive weeks later, often in systems your marketing team never sees. Leave them out and your best-looking campaign may be your worst.
5. Acting on data you haven’t checked
Broken tracking, stale feeds, and suspicious leads can make any campaign look like a star or a disaster. Check the data before you move the money.
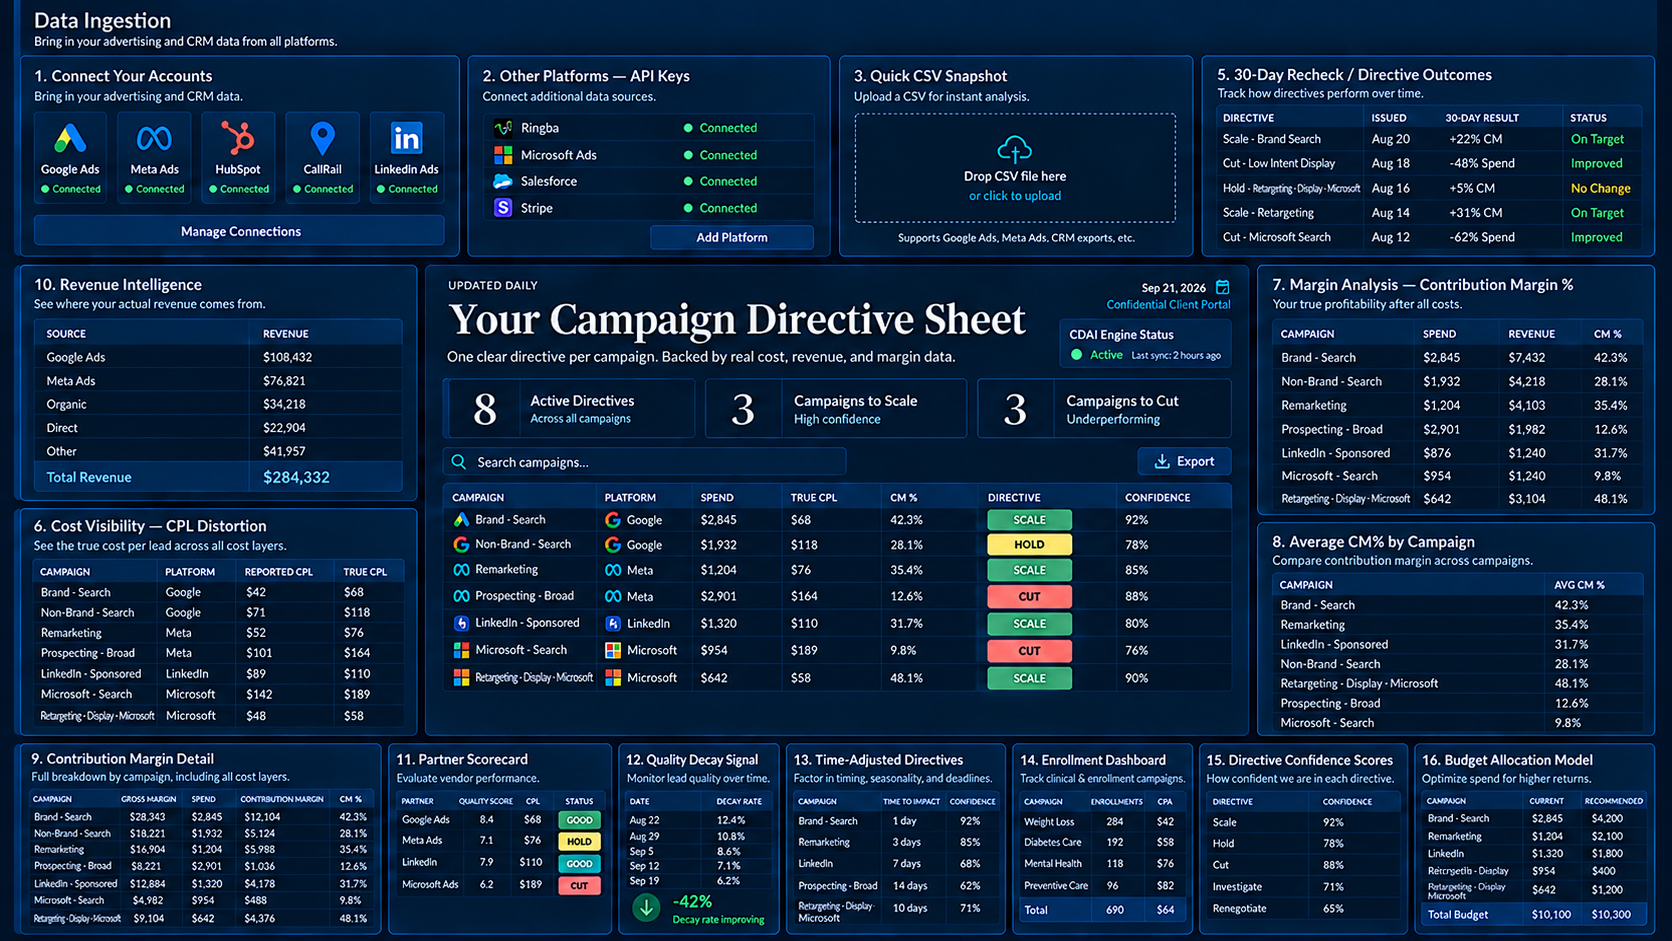
How CDAI Handles Marketing Budget Allocation Every Night
Doing marketing budget allocation this way by hand means pulling numbers from your ad accounts, your CRM, your payment processor, and your lead partners, then rebuilding the math every time something changes. CDAI (Capital, Decision, Accuracy, Intelligence), the engine behind Allocera Intelligence, does it automatically, working with the tools you already use.
It connects to your existing stack. Meta, Google Ads, LinkedIn, HubSpot, and Salesforce connect in one click. CallRail connects with an API key. There are also built integrations for Ringba, Boberdoo, Bing, and Stripe, plus CSV import and a webhook for any other system. You can start with one CRM and one ad account; see how it works.
Then, every night, for every campaign, it:
- Calculates real profit. True cost per lead, true customer acquisition cost, and real margin after every fee, partner payout, refund, chargeback, operating cost, and compliance cost.
- Makes one of eight decisions: scale, hold, cut, pause, quarantine, renegotiate, investigate, or flag, with the numbers and a confidence level behind it. You stay in control of every move.
- Waits for enough evidence. Thin data can’t trigger a scale call, and calls don’t flip-flop night to night. They change only when the numbers genuinely move.
- Judges each campaign on the right timeline. It uses a rolling window matched to your sales cycle (30 days by default), and it never cuts a campaign just because deals haven’t closed yet.
- Holds partners accountable. Close rate, payouts, refunds, and chargebacks for every lead partner, each with a risk tier.
- Stops on bad data. It flags stale feeds, revenue with no recorded spend, and campaigns missing from your ad platforms. Serious data problems stop that night’s calls instead of driving them.
It works alongside your CRM and attribution tools, not instead of them. They tell you who the customer is and which touchpoint gets credit. CDAI tells you whether each campaign made money after every cost, and what to do about it. The dashboard shows every campaign’s decision in one view.
Validated before release
Before release, CDAI’s decisions were checked in a controlled validation across 9 businesses in 7 industries: 89.5% accurate overall (1,210 of 1,352 scored decisions), with the underlying math matching 100%. Every decision type:
| Decision | What it tells you | Accuracy |
|---|---|---|
| Scale | Spend more here | 98.0% (818 of 835) |
| Hold | Keep this steady | 95.2% (40 of 42) |
| Pause | Stop this now | 85.2% (144 of 169) |
| Flag | A person should look at this | 70.9% (200 of 282)The other 82 were neutral; none were wrong. |
| Cut | Reduce spend | 55.6% (5 of 9)All misses came from one deliberately extreme stress-test business. |
| Investigate | Something needs a closer look | 100% (2 of 2) |
| Renegotiate | A partner is taking too much | 100% (1 of 1) |
| Quarantine | Suspicious data, kept out of decisions | Caught correctly in all 12 cases. The outcome depends on a person acting on it, so these 12 count as misses in the overall number. |
Read the full method and results in our contribution margin marketing validation report. Industry deep dives: HVAC and plumbing, personal injury law, and senior living.
Marketing Budget Allocation FAQs
What is marketing budget allocation?
It’s the process of deciding how much to spend on marketing and how to divide that money between channels and campaigns. Done well, it puts each dollar where it earns the most profit.
What is the 70/20/10 rule in marketing?
It’s a common budget split: about 70% to proven channels, 20% to growing ones, and 10% to experiments. It’s a useful planning guide, but it works at the channel level and can’t show which individual campaigns are losing money.
What percentage of revenue should go to marketing?
Gartner’s 2026 CMO Spend Survey puts the average at 7.8% of company revenue, mostly among larger companies. For your business, the better guide is profit: keep adding budget where an extra dollar returns more than a dollar of profit.
How do I decide which campaigns to scale?
In a profit-based marketing budget allocation, scale campaigns that are clearly profitable after every cost, with steady results and enough data to trust. Increase spend in steps and recheck profit after each step, because returns usually change as spend grows.
What is the difference between cutting and pausing a campaign?
Cutting reduces the budget but keeps the campaign running, for campaigns that are barely profitable or sliding. Pausing stops spend completely, for campaigns that are losing money after their deals have had time to close, or that show serious problems like a fraud spike.
How often should I change my marketing budget allocation?
Review your marketing budget allocation continuously, but move money only when the numbers genuinely change. Judge each campaign over a window long enough for its deals to close, often 30 days or more.
Can I allocate my marketing budget by ROAS?
ROAS is a quick efficiency check, but it leaves out refunds, delivery costs, partner payouts, and fees. Two campaigns with the same ROAS can earn very different profits, so base your marketing budget allocation on contribution margin instead.
Does CDAI change my ad budgets for me?
CDAI gives every campaign a clear decision each night, with the numbers and a confidence level behind it. You stay in control of every move.
Put Every Marketing Dollar Where It Earns the Most
Turn marketing budget allocation into a nightly decision instead of a monthly guess. Connect the CRM and ad accounts you already use. CDAI will calculate real profit for every campaign and tell you whether to scale, hold, cut, or pause it, every night.