Allocera Intelligence — CDAI Engine
Capital Distortion & Allocation Intelligence

The only engine that measures true margin per campaign.

CDAI assembles every cost across your campaigns into one true margin number per campaign, then tells you exactly what to scale and what to cut. If you're buying leads or running paid acquisition, the number your platform shows you is wrong by 30 to 70 percent.

$400K–$650K Typical monthly misallocation at $1M/mo spend (40-65% margin erosion)
6 Distortion signals detected weeks before existing dashboards show them
Zero Consumer PII stored. Option A architecture, live on Supabase Pro
The Problem

Every platform reports only the costs it controls.

Google Ads reports media spend. Meta reports its own numbers. Neither touches broker fees, post-conversion refunds, chargeback attribution, or compliance costs. The result is a cost-per-lead figure that looks clean and is materially wrong.

What your dashboard reports $11 Cost per lead · Platform-reported Incomplete
What you are actually paying $47 True all-in cost · After broker fees, refunds, compliance & chargebacks Structural gap
Proven on ad spend from $300/month to $1M+ — the gap between reported CPL and true contribution margin after hidden costs can represent 40-65% in misallocated capital. At $1M/month in spend, that's $400K-$650K bleeding monthly. In legal and clinical trial verticals, the disparity is materially wider. No existing tool assembles the complete picture.
How It Works

One margin number per campaign. One directive to act on it.

CDAI ingests cost and outcome data across every channel, reconciles true contribution margin after every hidden cost, detects six structural distortion signals, and issues a single enforceable capital directive per campaign — automated delivery on your data cadence.

01
Complete margin visibility
True contribution margin after media spend, platform fees, broker payouts, refunds, chargebacks, compliance costs, and variable costs. Not what the platform reports — what was actually earned.
02
Six distortion signals detected
CPL inflation, quality decay, fraud concentration, chargeback spikes, margin compression, and payout bleed — surfacing weeks before they appear in any existing reporting tool.
03
Enforceable capital directives
Scale, Hold, Cut, Quarantine, Renegotiate, Investigate, Pause, or Flag — one per campaign. Deterministic, confidence-scored, reason-coded, and tracked against verified financial outcomes.
04
Zero consumer PII stored
No names, emails, phones, or consumer identity enters the system. Compliance cost attribution works without identity data. Regulatory exposure dramatically reduced.
Proprietary methodology — available under NDA only The detection logic, directive classification engine, and attribution reconciliation framework are original intellectual property. Full methodology disclosure is available to qualified clients and partners under a signed NDA.
Live Intelligence Dashboard

Thirteen panels. Every decision your team needs to make, daily.

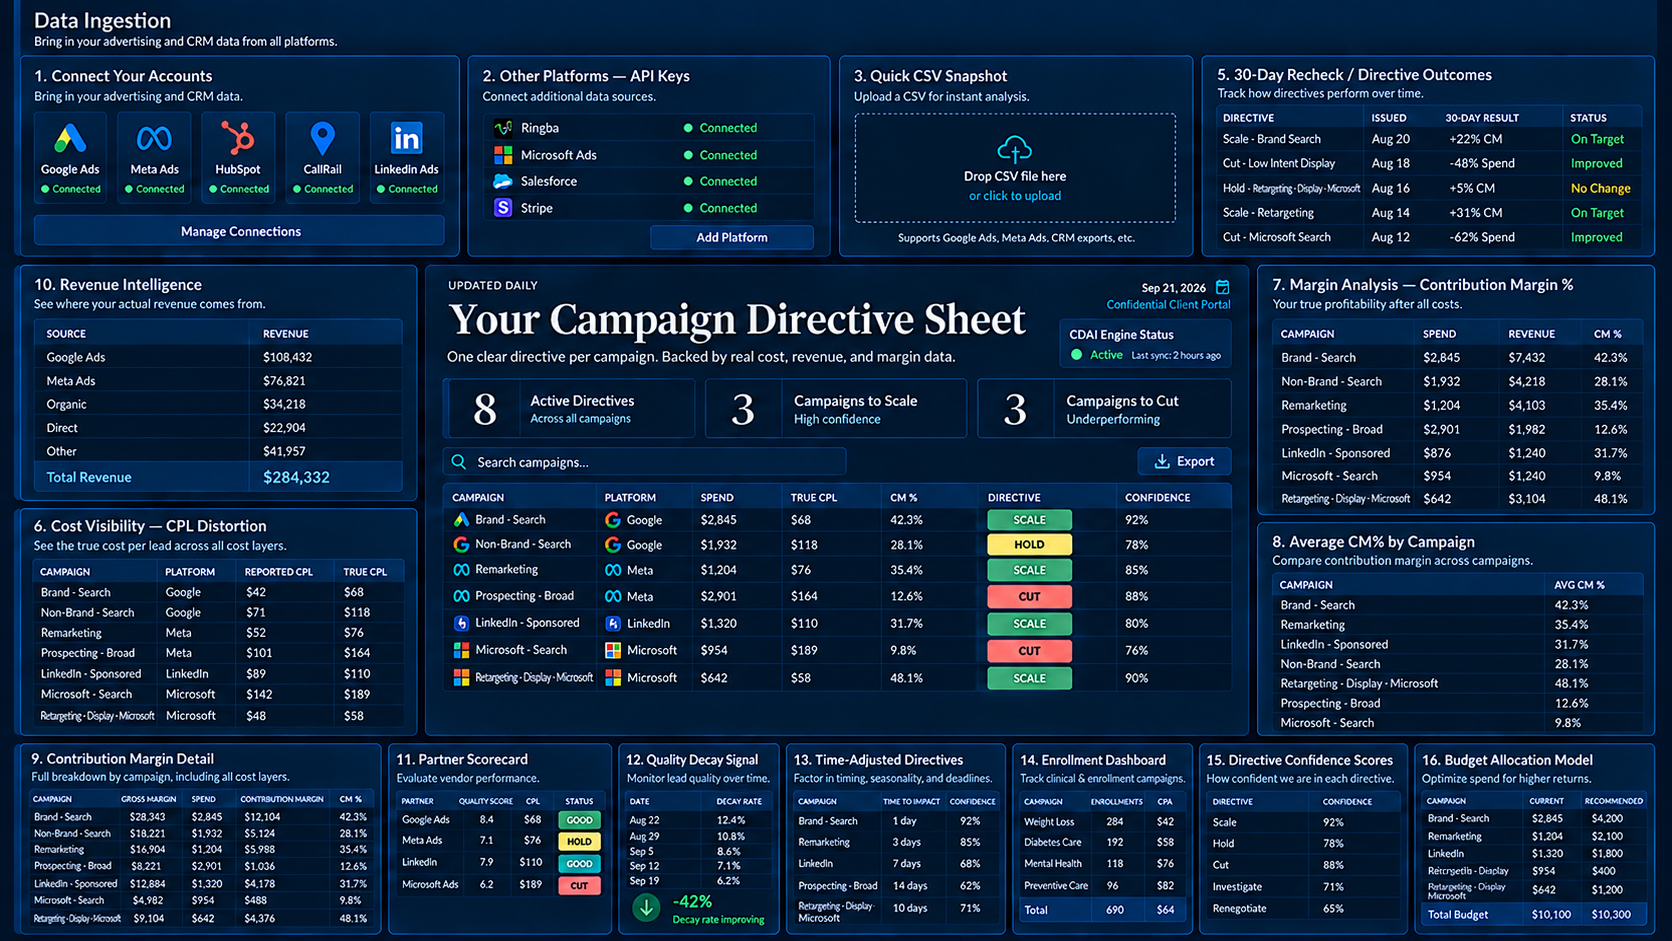
The CDAI dashboard is live and operational. All thirteen panels update daily from verified cost and outcome data. What you see is the actual output your team works from — not a mockup, not a demo environment.

CDAI Intelligence Dashboard
13 panels live
LIVE Enrollment Dashboard Fill Rate & Deadline Intelligence
For clinical trial and enrollment verticals: fill rate and projected unfilled cost at current pace through deadline. Directives adjust automatically when time pressure changes the math.
LIVE Time-Adjusted Directives Base vs Override
The base margin directive alongside the deadline-adjusted directive, side by side. When urgency overrides margin logic, the reason is shown explicitly — not buried in a setting.
LIVE System Health Engine Status
Live confirmation the engine is running and directive safety is cleared. Every output is gated behind this check before reaching your team.
LIVE CPL Distortion The Gap, Exposed
Platform-reported cost per lead against verified all-in cost per lead — side by side for every campaign. The number that changes how clients see their spend.
LIVE Average CM% by Campaign Signed Margin Bars
True contribution margin percentage per campaign as signed bars. Positive and negative campaigns separate immediately. Updated daily after full cost reconciliation.
LIVE VW Partner Scorecard Partner Margin View
Contribution margin view across all active partners. Surfaces which partner relationships are driving real margin and which are creating hidden drag across the cost stack.
LIVE Contribution Margin Detail Revenue · Cost · CM%
True revenue, verified total cost, and contribution margin percentage per campaign on a single row. The gap between what platforms show and what was actually earned is explicit on every line.
LIVE Directive Sheet One directive per campaign
SCALEMargin confirmed — increase spend
HOLDMaintain — data developing
CUTTrue margin is negative
PAUSEEmergency stop — immediate action
FLAGData anomaly — human review required
QUARANTINEFraud rate critical — pause campaign
RENEGOTIATEPartner margin bleed detected
INVESTIGATEQuality decay or chargeback spike
Deterministic, reason-coded, and timestamped. Never ambiguous.
LIVE Decay Alert Status Trend · Slope · Projection
Close rate trend per campaign over a rolling window. Declining quality surfaces as a distortion signal and projects forward — so you act before the margin impact arrives.
LIVE Directive Confidence Scores Scored & Tiered
High Medium Low
Every directive carries a numeric confidence score and a tier. Confidence determines how directives are surfaced and when they escalate for review.
LIVE Budget Reallocation Model Recoverable Spend
Capital recoverable through directive-driven reallocation — monthly and annualized. Turns the directive sheet into a projected financial outcome.
LIVE Partner Risk Scorecard Risk-Tiered by Performance
Every partner scored by leads delivered, close rate, payout efficiency, refund rate, and chargeback rate. High-risk partners surface automatically before payment clears.
LIVE VW Quality Decay Quality View · Decay Signals
Contribution margin view through the lens of lead quality decay. Identifies campaigns where declining close rates are compressing margin before the damage appears in standard reporting.
Competitive Position

No existing tool does all of this.

Every adjacent tool solves a fragment. Attribution tools handle channel spend. Lead distribution platforms track delivery. BI tools visualize what you give them. None assembles the complete cost stack and issues a directive.

CapabilityAttribution Tools
(Rockerbox, Triple Whale)
Lead Distribution
(boberdoo, LeadsPedia)
BI / Analytics
(Looker, Tableau)
CDAI Engine
True post-refund contribution margin
Broker payout reconciliationPartial
Compliance cost attribution
Automated capital directives
Confidence scoring per directive
Quality decay detectionPartial
Partner risk scoring
Budget reallocation modeling
Enrollment deadline intelligence
Zero consumer PII architecture
PROOF

The Engine That Refuses to Lie

Most marketing analytics tools display confident numbers on incomplete data. CDAI does the opposite: when the data isn't trustworthy, the engine flags it and refuses to issue directives. Here's what happened when we ran it on two real businesses with real data quality problems.

FULLSEND ORGANICKS · E-COMMERCE

Google Ads export. 94 days, $2,112 spend, 37 conversions. Data was complete but 4 months stale. The health monitor set directive_safe = FALSE and refused to issue directives.

Result: The engine refused to issue directives on stale data — exactly as designed. No fabricated numbers. No confident-looking outputs built on bad inputs.

APEX CARE SOLUTIONS · HEALTHCARE

Meta Ads export. 3.5 months, $2,414 spend, 7 campaigns. Lead attribution was missing — all 276 CRM records marked "Contact Import". The engine surfaced the gap and refused to invent attribution.

Result: The engine flagged the attribution gap and refused to invent data. When CFOs ask "how do I know your tool isn't hallucinating?" — this is the answer.

Multi-tenant isolation verified in production. Both tests ran against the same database with Row-Level Security policies active. No cross-organization data leakage. Complete technical validation available in the full case study.

READ FULL VALIDATION CASE STUDY
Pricing

Start small. Scale with proof.

Pricing based on verified scope and spend — not estimates. Audits prove the value. Retainers sustain it. Every engagement includes 100% audit credit toward retainer if started within 30 days.

Phase 1: Audits

Choose your audit based on campaign count. Final price confirmed within 5 business days of platform access. If actual scope differs significantly from the tier selected, pricing is adjusted in writing before work begins.

Standard Audit Up to 150 Campaigns $5,000 One-time · 7–10 days
2-3 platforms · 60-day lookback · Full cost stack verification · Directives with confidence scores and reason codes · Partner risk scoring
Deep Audit 150+ Campaigns $10,000 – $20,000 One-time · 10–14 days
All platforms · 90-day lookback · Complete partner accountability · Quality decay detection · Budget reallocation modeling · Enforcement-ready directives · 30-day portal access

Phase 2: Retainers

Ongoing monitoring with automated nightly updates. Tier determined by verified monthly ad spend observed through platform APIs during audit or first 30 days — not self-reported figures.

Growth Growth Retainer $3,500/mo Verified spend $10K–$50K/mo
Everything in Starter · Weekly directive reports · Quality decay tracking · Budget reallocation modeling · Slack support + monthly call
Scale Scale Retainer $8,000/mo Verified spend $50K–$150K/mo
Everything in Growth · Daily directive refresh · Partner risk scoring · Custom reporting · Weekly strategy calls
Enterprise Enterprise Retainer $15,000+/mo Verified spend $150K+/mo
White-glove service · Dedicated account lead · Custom integrations · Multi-vertical optimization · SLA-backed support · Quarterly executive reviews

Audit Credit: 100% of audit fee credited toward first 90 days of any retainer started within 30 days of audit delivery.

Why CDAI vs Attribution Tools & Agencies

FeatureAttribution Tools
(Triple Whale, Rockerbox)
Agencies
(Manual consulting)
CDAI
Enforceable DirectivesManual✓ Automated
Outcome Accuracy Tracking✓ 80% hit rate
True Margin (7-Cost Stack)Manual✓ Automated
Partner Accountability
Price$99–$999/mo$5K–$25K/mo$1.5K–$25K/mo
About

The engine was built by someone who lived the problem firsthand.

Nick Baum is the founder of Allocera Intelligence. His background is in performance marketing, paid acquisition, and full-funnel measurement — owning GA4 and GTM architectures, Google and Meta campaign management, and conversion tracking across live, revenue-generating operations in regulated environments.

Working directly inside lead generation operations, Nick encountered the same structural problem consistently: platforms report only the costs they control. Broker fees, post-conversion refunds, chargebacks, compliance costs, and variable overhead never appear in campaign reporting — which means the cost-per-lead number used to make scaling decisions is systematically wrong. The gap between what dashboards show and what campaigns actually cost is not a rounding error. At meaningful spend levels, it is a capital allocation problem that compounds every single month.

CDAI was engineered to solve that problem specifically. The system ingests data from ad platforms, CRMs, and lead distribution infrastructure — including boberdoo and LeadsPedia — reconciles every real cost layer, and issues one enforceable directive per campaign. It is not a visualization tool. It is a decision engine, built by someone who understood where existing tools stop and where the real problem begins.

Background & Certifications
Performance Marketing & Paid Acquisition6+ years
GA4 + GTM ArchitectureFull stack · live deployments
Lead Gen Stackboberdoo · LeadsPedia · TrustedForm
Google Analytics 4 CertificationIssued Jan 2026
Google Ads Search CertificationIssued Jan 2026
Google Ads Measurement CertificationIssued Jan 2026
What Is Already Built and Live
Distortion signals6 signals live
Capital directives8 types · issuing
Confidence scoringPer directive · tiered
Platform coverageMulti-platform
Intelligence dashboard13 panels live
Time engineEnrollment tracking
Consumer PII storedZero · Option A
Client Intake

Request your Distortion Audit.

Tell us about your campaigns and data sources. We'll review your submission and reach out within 24 hours.

01
Submit this formCampaign-level information only. No consumer PII required at this stage.
02
Sign NDA and Service AgreementProtects your data before anything is shared. Required before any data access begins.
03
Provide read access or CSV exportsGoogle Ads, Meta, refund history, chargeback data — 90 days minimum. No consumer PII.
04
Receive your Directive Sheet within 14 daysTrue CM% per campaign, distortion signals identified, and enforceable capital directives.
Please fill in all required fields.

Request Received

We'll review your submission and reach out within 24 hours. Check your email for a confirmation.

Scroll to Top