The campaign analytics dashboard your team works from every morning.
The CDAI campaign analytics dashboard is not a mockup. It is a live production interface — 14 intelligence panels, updated automatically every night, showing verified cost data and one enforceable directive per campaign. See the real client proof or review pricing when ready. According to Google Ads, platform dashboards only show what the platform controls — not your true margin.
See the campaign analytics dashboard in action.
This is the actual dashboard your team would open every morning. Every campaign has a status, a directive, and a confidence score. No interpretation required — read the directive and act.
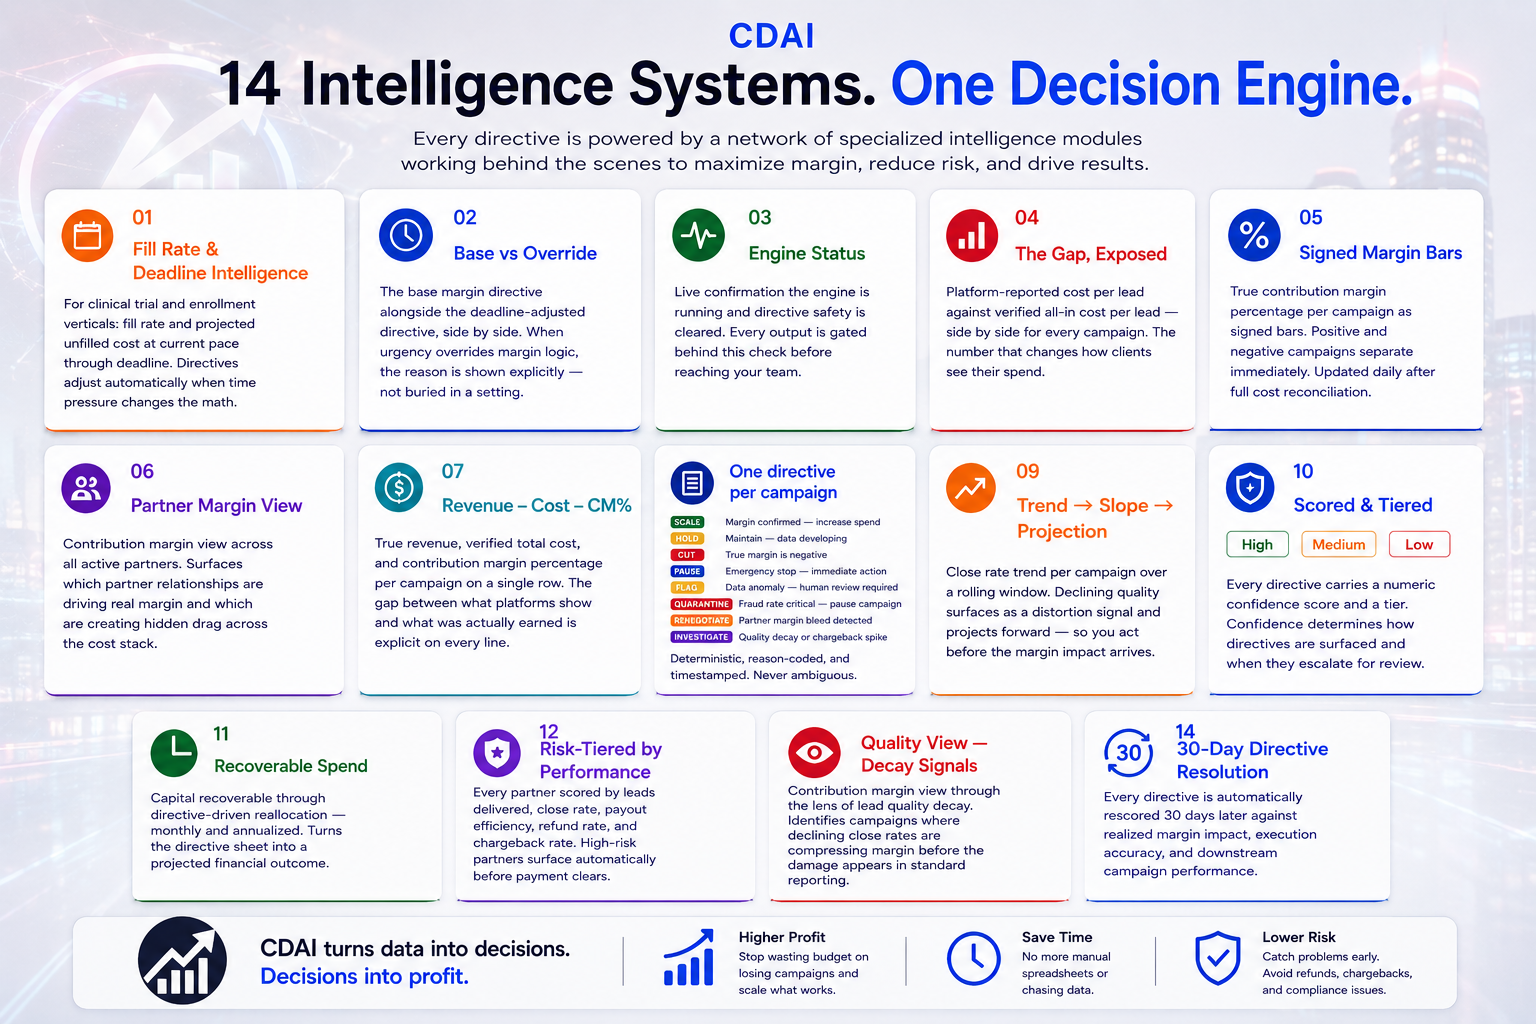
Every panel. What it shows. Why it matters.
The campaign analytics dashboard has 14 panels — each one built around a specific decision your team needs to make. Nothing decorative. Nothing that requires a data analyst to interpret.
Every source the dashboard connects to automatically.
The campaign analytics dashboard pulls from every cost source via API — no manual exports, no spreadsheets. Read-only access only. Consumer identity data is stripped before processing.
What people ask about the dashboard.
See your campaigns in the dashboard. Start free.
One campaign. 30-day lookback. No consumer PII. We run it through the full CDAI cost stack and show you your real numbers — free, in 5–7 business days.
Request Received
We'll review your submission and reach out within 24 hours.