A marketing dashboard that shows profit per campaign, not just clicks.
A typical marketing dashboard shows clicks, leads, and spend. The CDAI dashboard shows what each campaign actually made after every cost, what its leads really cost, and one clear decision for every campaign, refreshed every night. See it in action below, or read how it works.
See the marketing dashboard in action.
This is the CDAI dashboard your team opens each morning. Every campaign has its real numbers, a decision, and a confidence level behind it.
What a marketing dashboard should answer.
Wrike describes a marketing dashboard as a reporting tool that pulls key metrics from multiple channels into a single, easy-to-read view. In practice, most teams build one in their CRM or a reporting tool, filtered to show things like “ad spend, ROI, clicks, form submissions, and traffic by source,” as one HubSpot community answer puts it.
That view answers “what happened in the ads?” The owner of a lead-driven business needs three different answers:
- Did each campaign make money after partner payouts, refunds, chargebacks, fees, and the cost of delivering the work?
- What does a lead really cost, compared with what the ad platform says?
- What should I do with each campaign tomorrow?
The CDAI marketing dashboard is built around those three questions. The numbers come from the CDAI engine, which calculates them every night from your connected ad accounts, CRM, and other tools.
Marketing dashboard example.
This is an illustrative example with sample numbers, not client data. It shows the core view: every campaign on one row, with the platform’s number next to the real one and tonight’s decision.
| Campaign | Dashboard CPL | True CPL | Real profit (30 days) | Decision | Confidence |
|---|---|---|---|---|---|
| Search: brand terms | $38 | $46 | $9,400 | SCALE | High |
| Search: service terms | $64 | $81 | $2,100 | HOLD | Medium |
| Social: lead form | $22 | $41 | −$600 | CUT | Medium |
| Partner: bought leads | $55 | $112 | −$3,800 | PAUSE | High |
On a normal marketing dashboard, the social lead form looks like the cheapest source at $22 a lead. Once refunds, payouts, and fees are counted, it costs $41 and loses money. The bought leads look reasonable at $55 until partner payouts and returns are added. That’s the gap the CDAI dashboard exists to show. Our guide to the average cost per lead explains why the platform number runs low.
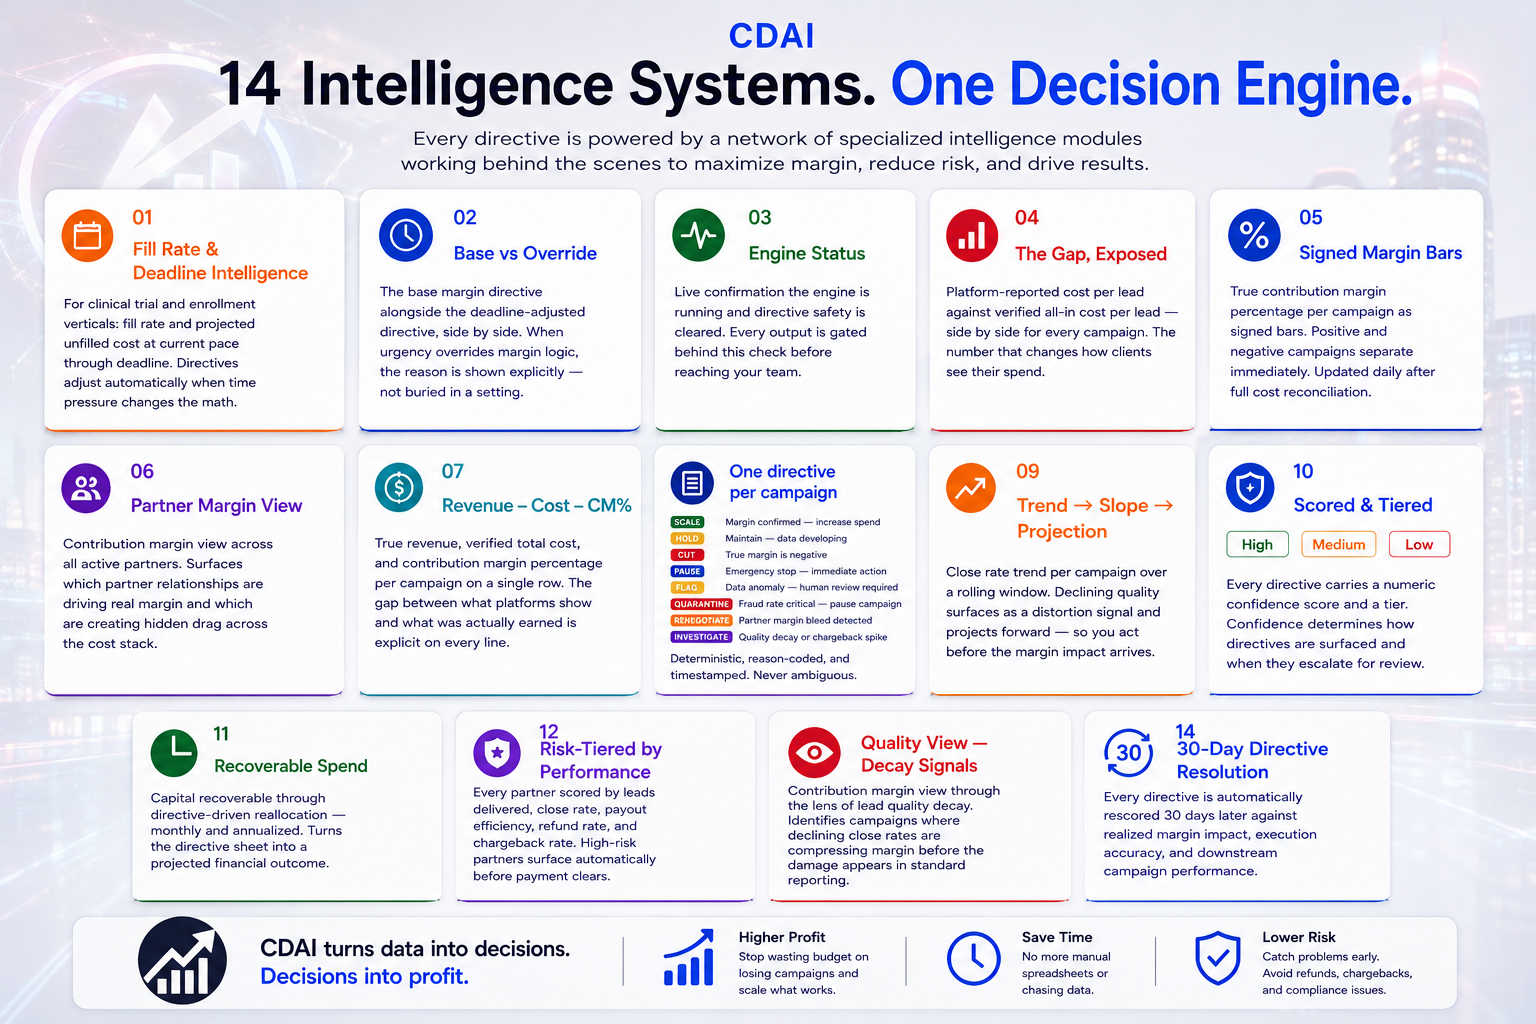
Every view. What it shows. Why it matters.
Each part of the CDAI marketing dashboard is built around a decision your team needs to make. Nothing decorative, and nothing that needs an analyst to interpret.
Behind every view, CDAI rechecks its own math each night and stops on bad data instead of showing numbers it can’t stand behind. The dashboard recommends; you decide what changes in your ad accounts.
How to use the marketing dashboard each morning.
- Start with the decisions. Look at anything marked cut or pause first; that’s where money is leaving.
- Check the CPL gap. A big difference between dashboard CPL and true CPL means costs outside the ad account are growing.
- Scale the proven winners. Add budget where real profit is strong and confidence is high.
- Watch the warning signs. A slipping close rate today becomes a losing campaign next month.
Our scale, hold, cut, pause framework goes deeper on turning each decision into a budget move, and the lead quality guide covers what to do when a source’s leads stop closing.
CDAI vs. a typical marketing dashboard.
| Typical marketing dashboard | CDAI dashboard | |
|---|---|---|
| Main numbers | Clicks, leads, spend, ROI from the ad platforms | Real profit, true cost per lead, and margin per campaign |
| Costs counted | Mostly ad spend | Ad spend, fees, partner payouts, refunds, chargebacks, compliance, and operating costs you add |
| What you do with it | Interpret charts and decide yourself | Read one clear decision per campaign, with the reasons |
| Setup | Build and maintain the reports | Connect your accounts; the engine fills it every night |
Before release, CDAI was validated on simulated businesses where the true answer is known. The method and every result are in the contribution margin marketing validation report.
Every source the dashboard connects to.
Meta, Google Ads, LinkedIn, HubSpot, and Salesforce connect in one click. Other tools connect by API key, CSV upload, or webhook.
Marketing dashboard FAQs.
What is a marketing dashboard?
Can you give me an example of a marketing dashboard?
What are the three types of dashboards?
How often does the CDAI dashboard update?
Does the dashboard change my ads?
How do I get access?
See your campaigns on the dashboard.
Connect the ad accounts and CRM you already use, and your first numbers arrive after the first nightly run. Questions first? Send us a note and we’ll get back to you.
Request Received
We’ll review your submission and reach out within 24 hours.